For Shopify brands running paid trafficFor Shopify brands

Your ads are working.
Your pages are not.

You pay for every click. We build the pages your traffic lands on, A/B test each one against your current page, and send you a one-page readout with the number.

30 minutes. No slides, no pitch. You leave with your first three tests.

$1M+ in extra revenue generated by our team across 50+ stores. 10M+ users in A/B tests.

A team of three senior specialists in marketing, sales and development.

Programs and tools we work in

Shopify Partners badge Intelligems logo Heatmap.com badge

ResultsThe offerFAQES

  • 50+ stores optimized
  • $1M+ in extra revenue generated
  • 10M+ users tested
  • 1,000+ A/B tests launched
  • 300+ winning tests
What goes wrong

Tried CRO before? Here is
why the number did not move.

Not because testing does not work. Because of what got tested, and what never shipped. If you have not tried it yet, this is what to avoid.

1

You pay for traffic that lands on pages never built to sell.

The ad promises one thing, the product page says another.

2

Your last agency delivered a deck. The conversion rate stayed put.

Sixty-page audits and heatmaps, nothing shipped, nothing tested.

3

The last program tested button colors and called it CRO.

Small tests on a broken funnel give small, inconclusive results.

In numbers

10M+

Users in A/B tests we ran, per the testing tools.

50+

Shopify stores worked on.

1,000+

A/B tests launched.

300+

Tests concluded as winners.

Results

Tests we ran. Numbers as
the testing tool reported them.

Seven A/B tests we ran in 2024 and 2025, stores anonymized. All lifts are conversion rate; four cleared 95% confidence.
Control
Control page of the test, store details blurred
Variant
Variant page of the test, store details blurred
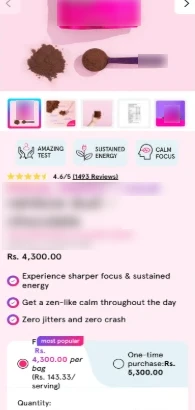
Product pageCleared 95% confidence
+11.01%conversion rate7.64% to 8.48%, 99.12% confidence

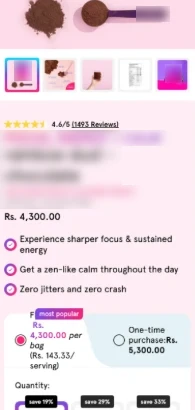
Product benefits moved to the top of the PDP

Hypothesis: benefits near the top of the PDP show what makes the product different before the visitor scrolls.
21 days, 26,266 users, 2,119 conversions

Control
Control page of the test, store details blurred
Variant
Variant page of the test, store details blurred
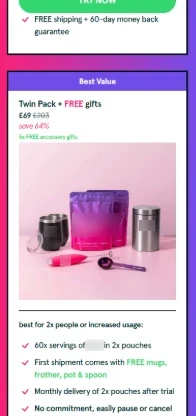
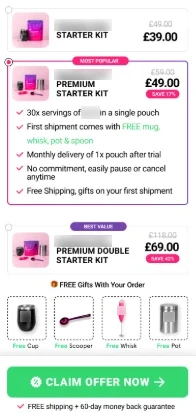
Landing pageCleared 95% confidence
+32.41%conversion rate1.33% to 1.76%, 98.08% confidence

Bundle layout redesigned: tiers, savings and one clear CTA

Hypothesis: clear value, savings and tiers make the bundle easier to understand and buy.
11 days, 18,642 users, 288 conversions. Revenue per visitor +101.94% at 90.70%.

Control
Control page of the test, store details blurred
Variant
Variant page of the test, store details blurred
Product pageCleared 95% confidence
+25.36%conversion rate2.67% to 3.35%, 96.65% confidence

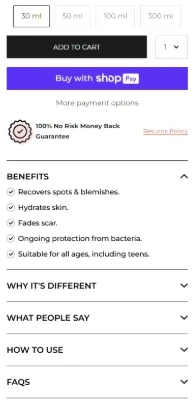
Below-the-fold product details rebuilt as dropdowns

Hypothesis: long descriptions overwhelm on mobile; dropdowns make them easier to digest and scroll.
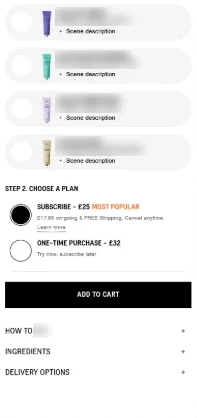
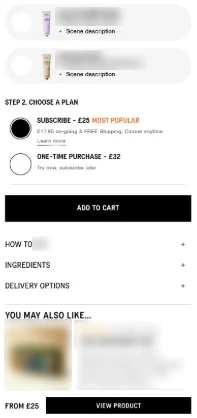
19 days, 10,702 users, 322 conversions. Revenue per visitor +15.69% at 85.72%.

Control
Control page of the test, store details blurred
Variant
Variant page of the test, store details blurred
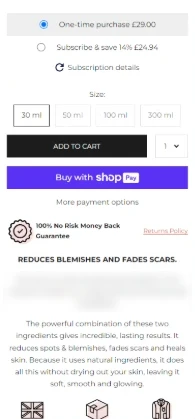
Product pageCleared 95% confidence
+17.67%conversion rate2.18% to 2.56%, 96.84% confidence

Discovery set offered as the "you may also like" upsell

Hypothesis: a low-cost discovery set lets shoppers unsure about the full size try more products.
30 days, 25,406 users, 601 conversions

Control
Control page of the test, store details blurred
Variant
Variant page of the test, store details blurred
Collection pageDirectional, not a win
+17.19%conversion rate1.14% to 1.34%, 90.57% confidence

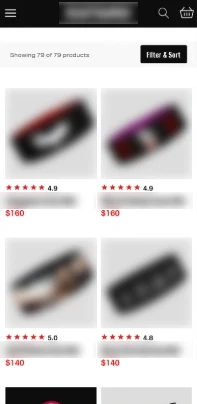
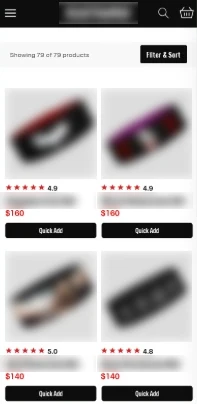
Quick add with a variant modal on collection pages, apparel

Hypothesis: quick add with a variant modal cuts the steps from browsing to cart.
117 days, 38,552 users, variant 2. Add to cart +9.27% at 91.94%.

Control
Control page of the test, store details blurred
Variant
Variant page of the test, store details blurred
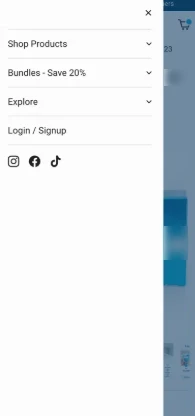
Navigation menuDirectional, not a win
+9.56%conversion rate12.99% to 14.23%, 87.51% confidence

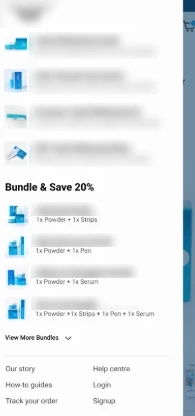
Drawer menu redesigned with product categories and images

Hypothesis: categories and product images in the menu get more engagement and conversions.
26 days, 4,429 users. Revenue per visitor +10.50% at 88.54%.

Control
Control page of the test, store details blurred
Variant
Variant page of the test, store details blurred
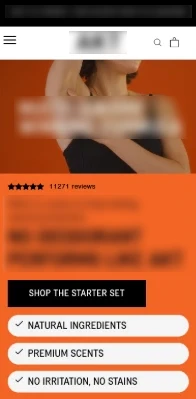
HomepageDirectional, not a win
+7.84%conversion rate1.61% to 1.74%, 89.87% confidence

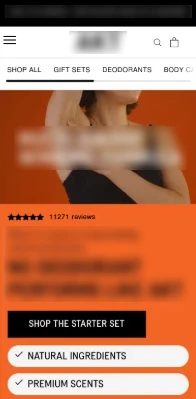
Quick links above the fold on the homepage

Hypothesis: quick links at the top of the homepage get visitors to products faster.

29 days, 72,185 users. Collection page views +30.16% at 99.99%.

1 / 7

Real screenshots from the tests, with store names and product details blurred. Confidence as reported by the testing tool. Six tests in health and wellness, one in apparel.

The offer

One partnership. Everything
your paid traffic needs.

Conversion Growth Partner

Pages, offers and funnels. Built, A/B tested, measured.

What's included:

  • Full funnel audit: every leak from click to checkout, ranked by revenue impact in week 1.
  • Every launch as an A/B test: sized to your traffic; nothing replaces your page until it beats it.
  • Store pages rebuilt where the money is: PDP, collection, cart and menu, like most of the tests above.
  • Offers and funnels matched to your ads: advertorials, listicles, quizzes and sales pages, where they beat the store page.
  • Upsells and AOV boosts: more revenue from every order you already get.
  • Measurement before test one: GA4 events, testing tool and baseline written down first.
  • A readout after every test: control vs variant, confidence and the decision, on one page.
Free Growth Audit Call →
Performance guarantee

One metric, agreed before test one. Not moved in 3 months? Month 4 is on us.

MetricConversion rate or revenue per visitor on the pages we test, chosen at kickoff, measured against your current page as the control.
Window3 months of shipped tests.
RemedyMonth 4 is free and we keep testing. How it is measured is in the FAQ.
How it works

Four steps.
You see every one.

One audit, then hypotheses, live tests and a readout for each. One 30-minute call a month, async the rest.

01Wk 1

Audit

We walk your store the way a buyer does, from ad to checkout. Every leak written down with its number.

02Wk 1 to 2

Hypothesis and priority

Each leak becomes a hypothesis: what changes, for whom, which metric moves. Ranked by revenue impact and effort.

03Wk 2 to 5

Build and launch as an A/B test

Built in your theme, sized to your traffic, launched as a split test against the current version.

04Test end

Readout and next test

The readout (format below) makes the winner the new control, logs the loser as a learning, queues the next test.

Sized before it starts: a worked example, not client data

15,000 monthly sessions, 2.4% baseline, two variations, 4 weeks at 95% confidence and 80% power: smallest detectable lift about 30% (2.4% to roughly 3.1%). At 50,000 sessions, about 17%.

The format, fixed before test one.

Measurement

What you get after every test.

  • Control vs variant: conversion rate, revenue per visitor, AOV, confidence level
  • Days running, sample size, significance reached or not
  • The decision: roll out, iterate or kill, and why. Never a "directional" win called early.
Free Growth Audit Call →
Client reviews

What clients say about working with us,
in their words.

Public reviews from clients of our team, quoted verbatim. First name or initial and country only.

  1. Thorough about testing... so we can make sure we aren't leaving money on the table with the traffic we're already paying to send there.

    ★★★★★Noah, US

  2. Played a pivotal role in helping us optimize our conversion rates.

    ★★★★★K., US

  3. Quick response times, always happy to help with ad hoc development, and intuitive ideas on how to adapt strategies to improve conversion across all areas of the business.

    ★★★★★S., GB

  4. They really know what they are doing in the CRO space.

    ★★★★★Wian, ES

  5. Super helpful and supportive. The response times are insanely fast and no test is impossible.

    ★★★★★Sergio, IE

Why DTC Lab

What changes when three
senior specialists run it.

We do not sell tests. We sell a higher number, and the test is how both sides know it moved.

DTC LabThree senior specialists
DIY with AI audit tools
Big CRO agency
What lands on your store
DTC LabA ranked backlog and tests live on your store
DIYA long list of generic findings
AgencyA monthly report and a roadmap
Who does the work
DTC LabThe same senior team on every call and test
DIYYou, after hours
AgencyStrategist, designer and developer, with an account manager in between
Testing
DTC LabEvery launch, against your current page
DIYNone, unless you set it up yourself
AgencyRun by their team, reported monthly
Time to first live test
DTC LabWeeks 2 to 5
DIYMonths, if ever
AgencyAfter onboarding and a strategy phase
Who owns the pages and data
DTC LabYou: every page, the data, the testing tool
DIYYou
AgencyOften the agency's testing-tool account; confirm in the contract
Who you work with

Three senior specialists.
No handoffs.

Audits, tests and readouts by the people you work with directly, all three with a background in marketing and ecommerce.


  • Valentín Schiaffino

    Marketing · Senior CRO Specialist

    LinkedIn
  • Gabriel Garofalo

    Marketing & Sales · Sales Expert

    LinkedIn
  • Emilio Chiarlone

    Development · Software Engineer

    LinkedIn

How we work

Tools: Convert, Intelligems, GA4, Heatmap.com, Shopify. contact@dtclab.io

  • 01Numbers are copied from your store and analytics, never estimated.
  • 02A finding ships only if we saw it live on your store that day.
  • 03What we have not exercised is written as "not verified".
FAQ

Asked before
the call.

Something not covered? Write to contact@dtclab.io

Do I need a minimum amount of traffic?

Our monthly program starts at 50,000 monthly sessions to the tested page: at that traffic a split test detects finer changes (at around 15,000 sessions it only detects about a 30% lift in 4 weeks). Below that we say so on the call. Sizing is explained under Measurement.

How much does it cost?

One flat fee, USD 1,500 to 6,000 a month depending on the store and how many tests its traffic supports. Confirmed after the week-1 audit, never a percentage of revenue.

What happens when a test loses?

Written up like a win: what we expected, what happened, what we learned. A loser stops you from shipping something worse to all your traffic.

What do I need on my side?

Shopify collaborator access, read access to GA4 and your ads account, an A/B testing tool or budget for one, and about 2 hours of your time a month.

How is the guarantee measured?

In the testing tool, not on a before-and-after of your analytics, which seasonality, promos and ad spend confound. Moved means the rolled-out winners, measured control vs variant over the 3 months, add up to a higher conversion rate or revenue per visitor on the pages we tested. The math is in the month-3 readout.

How do we get started?

Book the call. We go through your store and your ads with you, you leave with your first three tests, and you decide. If it is a fit, we agree on a start date; if not, the notes are yours.

Next step

Your ads bought the click.
Make the page earn the sale.

Thirty minutes on your store and your ads. You leave with your first three tests and a clear answer on fit. Room for 2 more partner brands, as of October 2026.